PIXPEL
Fair Token Price Estimation
1. Simulation Setup
This simulation for PIXPEL aims to estimate a fair token price for the $PIXPEL governance token considering the token economic model and business model forecast over a period of 6 years. To establish a fair token price, we employ the Quantity Theory of Money (QTM) model, which links the money supply, velocity of money, total transaction volume, and price level of an economy. The most widely used valuation methodology for utility tokens is the quantity theory of money and, more precisely, the Equation of Exchange (EoE). Several models based on those principles have been developed and widely accepted by the cryptocurrency community. The following equation serves as the foundation: M x V = P x T The formula mentioned above is not directly applicable to cryptocurrencies, a common mistake in this context. In a token or cryptocurrency economy, the two sides of the equation are denominated in different units. When discussing the system's GDP, expected revenue is typically used. However, calculating the value in a token economy requires an additional parameter to represent the exchange rate between the token and USD (or any other fiat currency based on the denomination of the system's GDP). The formula mentioned above is not directly applicable to cryptocurrencies, a common mistake in this context. In a token or cryptocurrency economy, the two sides of the equation are denominated in different units. When discussing the system's GDP, expected revenue is typically used. However, calculating the value in a token economy requires an additional parameter to represent the exchange rate between the token and USD (or any other fiat currency based on the denomination of the system's GDP). The paper ‘Improving the Equation of Exchange for Crypto Asset Valuation using Empirical Data’ shows a rewritten version of this formula, which can be used to estimate token price. It also shows the relation between velocity and holding time, allowing the use of holding time in calculations. This is useful considering acquiring holding time data is easier and more intuitive. price = exp . ( 0.96607 + 0.99410log(T) + 0.98800log ( 1 / M ) + 0.45132log(H’)) V’ = 0.03358 + 1.20339 * 1 / H’ for H > 0 This price formula is used in our simulation. The simulation will be doing a range of calculations, in which parameters for each run and timestep are drawn from their respective distributions. We can then use means and standard deviations to represent and plot simulation results.
1.1 Simulation Method
The Monte Carlo simulation methodology underpinning this method introduces a layer of probabilistic forecasting by generating multiple distinct forecasts, each exhibiting nuanced fluctuations. This variability in our simulation stems from random draws of key variables from specified distributions every time they come into play, resulting in the creation of 1000 unique forecasts.
1.2 Disclaimer
Important to note is that the simulation builds upon some assumptions, forecasts, and estimates. If these are not truths and guarantees, the simulation won’t be either. If we see any opportunity to optimize this input data then we should consider doing that to optimize the accuracy of the simulation.
2. Parameters
2.1 Circulating Supply (M)
This is the money supply. In the case of crypto, this is the circulating token supply. It will be obtained using the vesting schedule determined in the tokenomics.
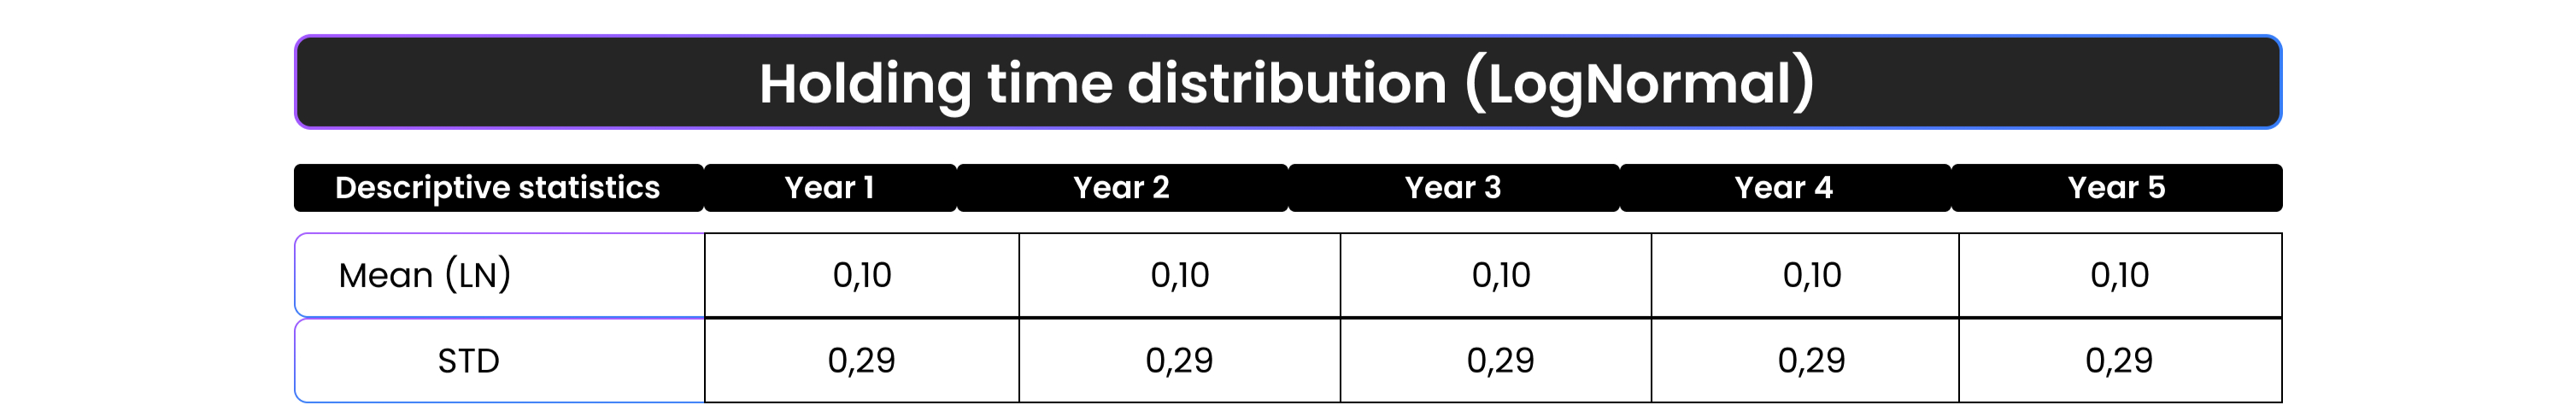
2.2 Holding Time (H)
Holding time represents the average time a token remains in the same wallet. According to research, holding time is lognormally distributed in tokenized projects. To find the mean of the lognormal distribution we take the LN of the mean holding time in days, as estimated using benchmarked projects. These distributions are a rough estimate based on manual observations. More benchmarking is required for an accurate fit. For each run and timestep holding time will be drawn from its distribution again, guaranteeing stochasticity.
2.3 Transaction Volume (T)
A significant portion of PIXPEL’s transaction volume will stem from its governance mechanism, which allocates platform revenue (collected in stablecoins) across various purposes. A primary use of this revenue is token buybacks, as rewards are distributed in $PIXPEL tokens rather than directly in stablecoins and operations funding, even though it likely requires stablecoins, which might be done through buybacks and then selling the tokens through a market maker. The rewards being sold on by the receiver and tokens being sold back to the exchange through a market maker will probably increase transaction volume. However, this is not documented. The only concrete numbers that can be seen as a transaction volume forecast, are the expected revenue numbers. Therefore, the revenue forecast will be used as the transaction volume forecast in the QTM calculations.
3. Simulation Results
3.1 Price Development
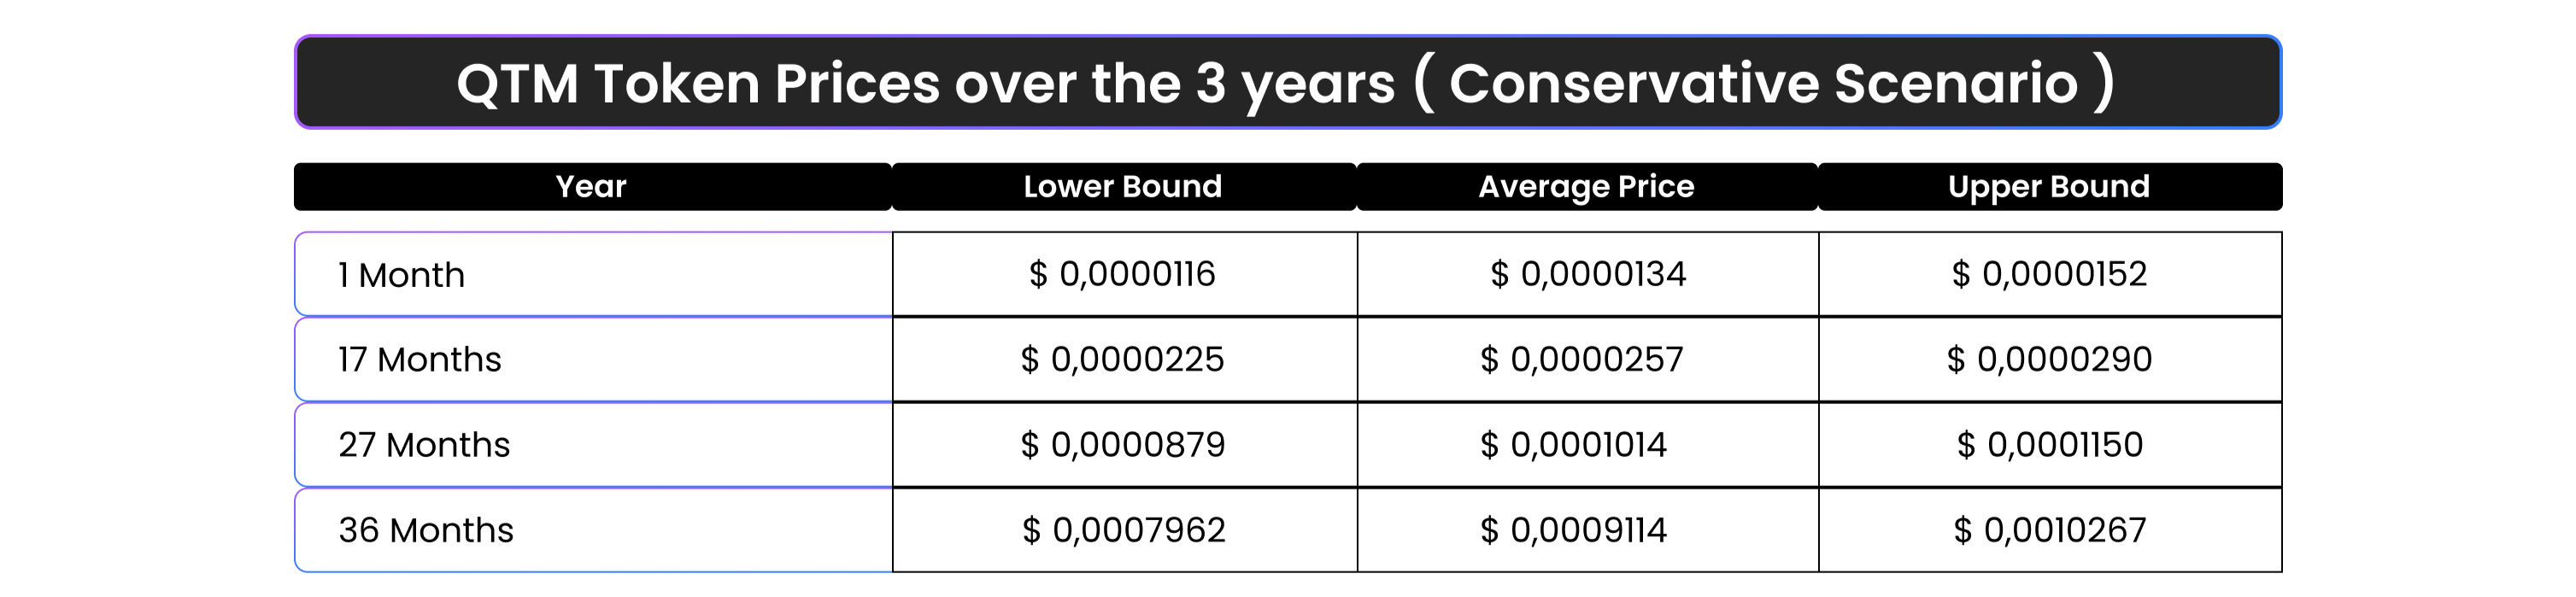
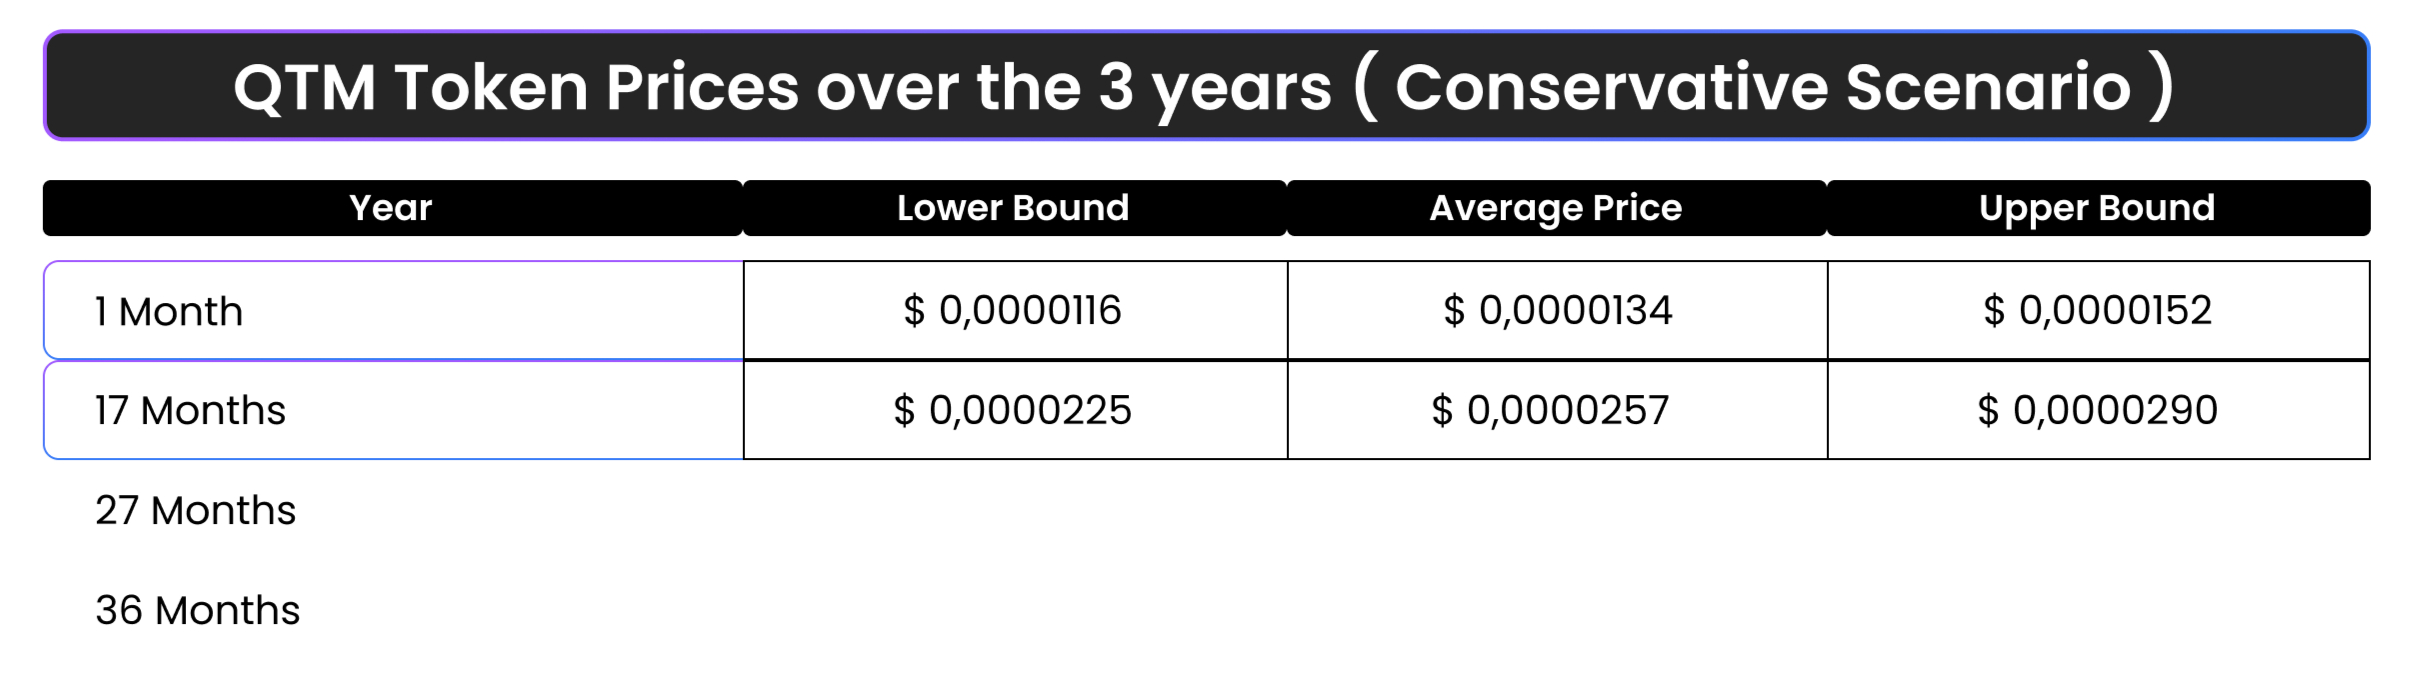
a) Conservative Scenario
QTM Price Simulation ( Conservative Scenario)- 3 years

QTM Price after 3 years ( Conservative Scenario)

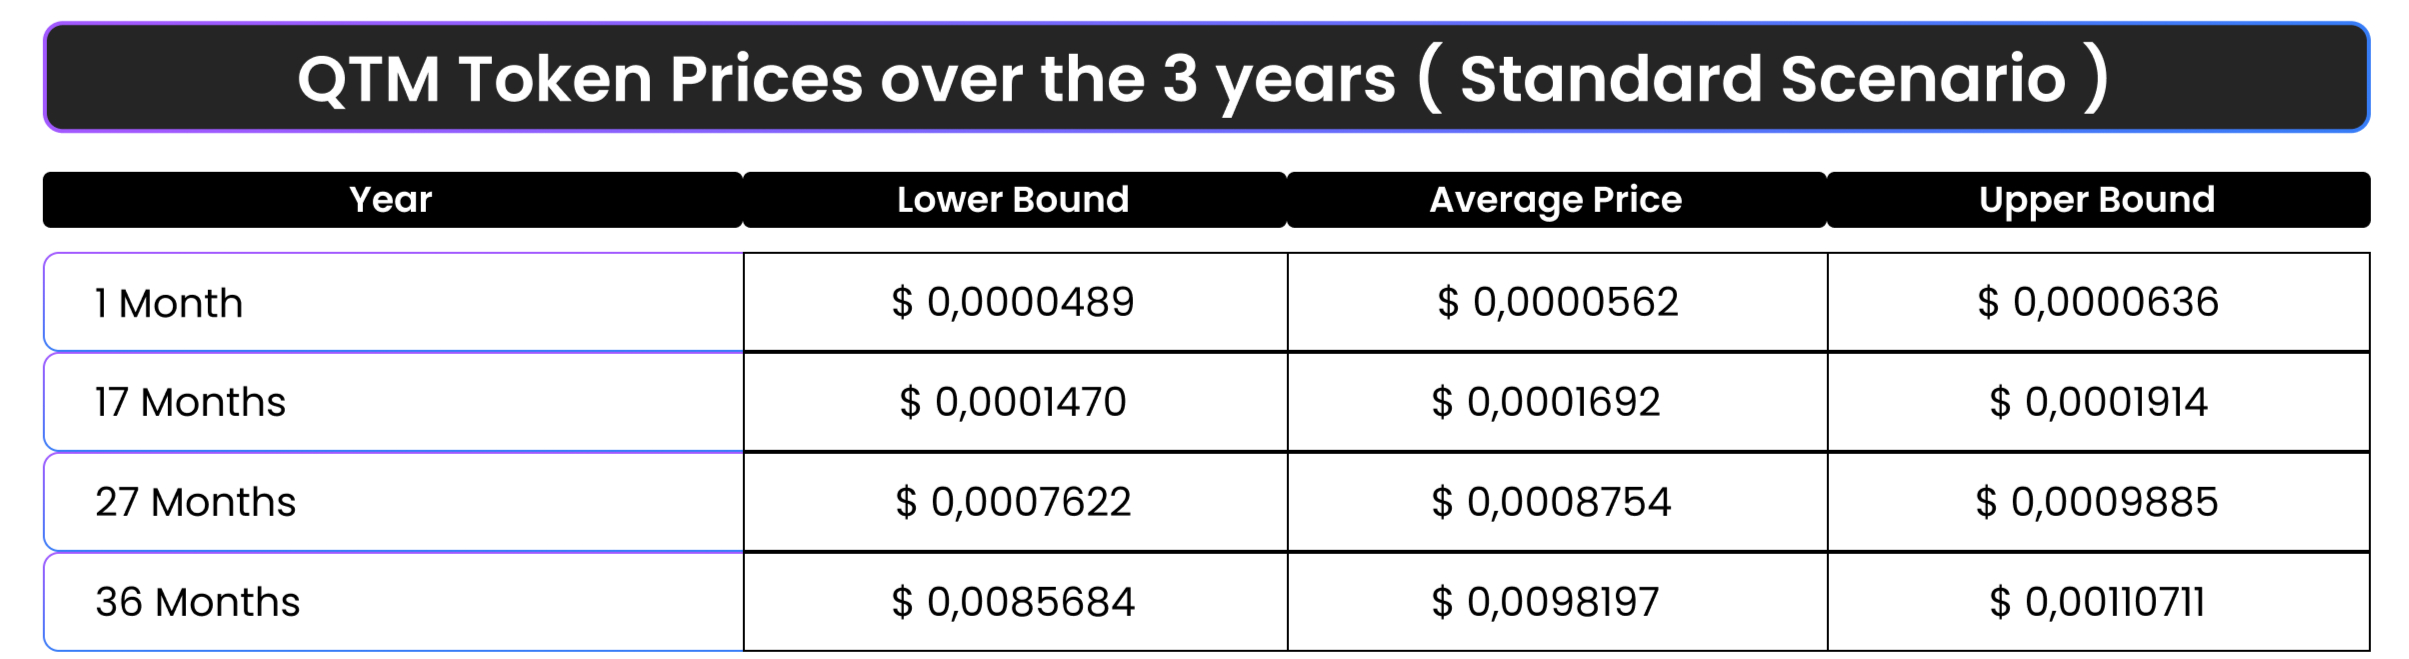
b) Standard Scenario
QTM Price Simulation ( Standard Scenario)- 3 years

QTM Price after 3 years ( Standard Scenario)

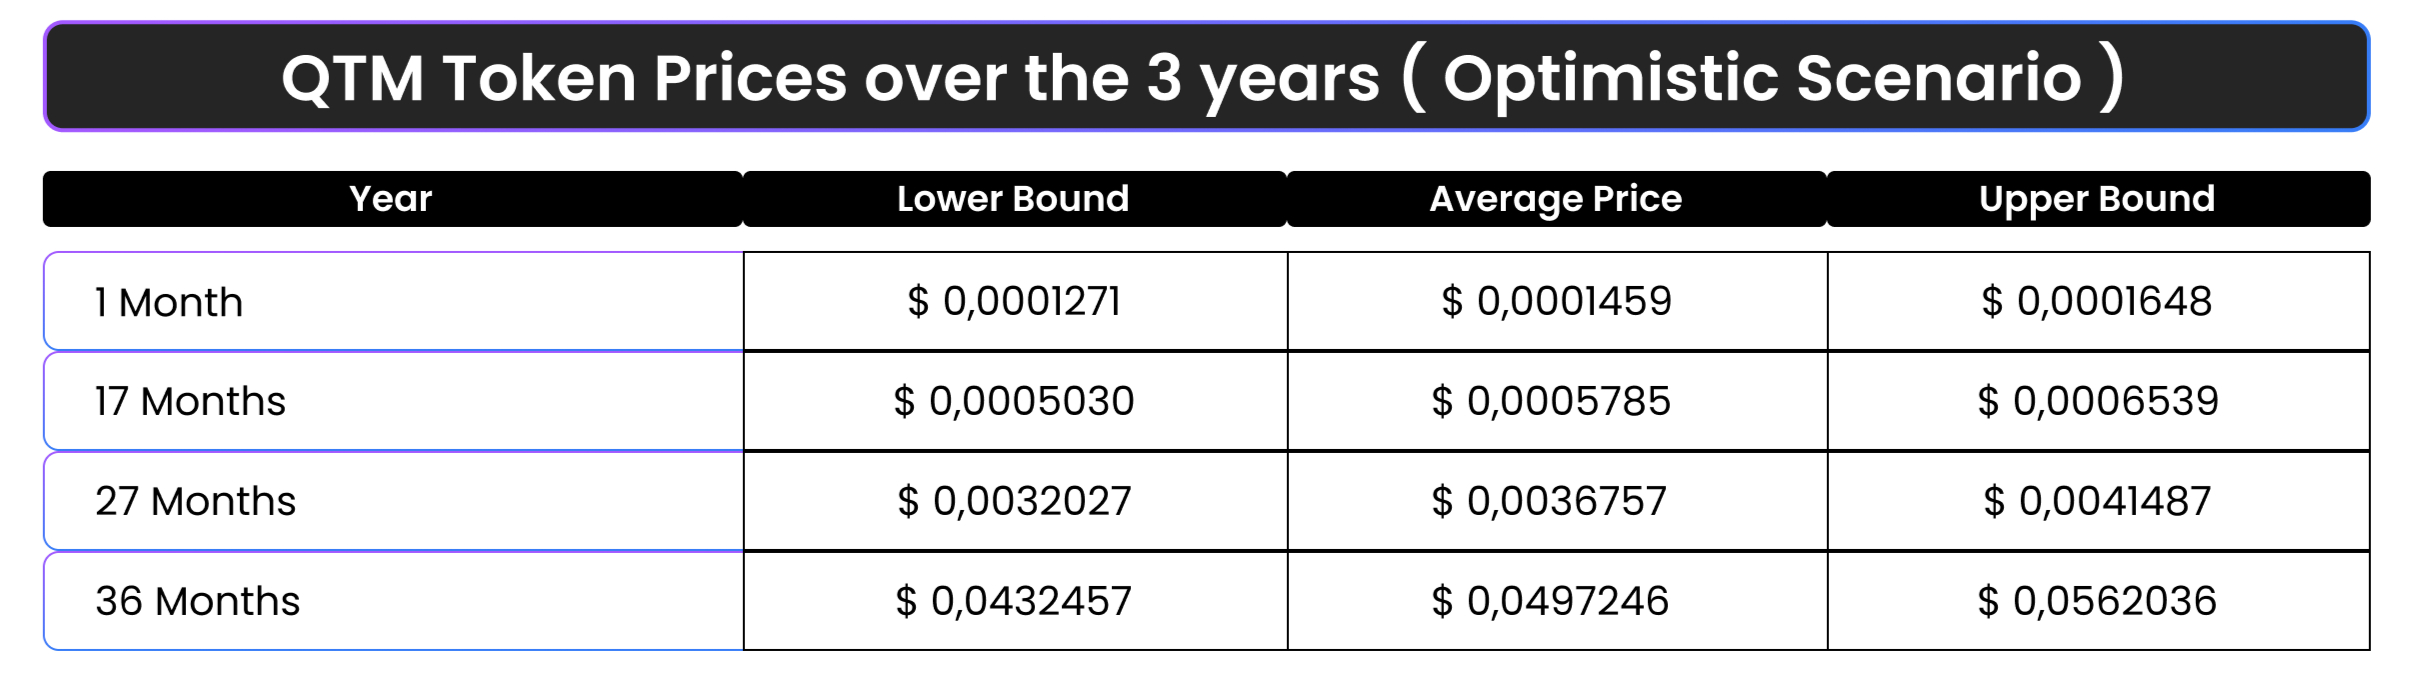
c) Optimistic Scenario
QTM Price Simulation ( Optimistic Scenario)- 3 years

QTM Price after 3 years ( Optimistic Scenario)

4. Conclusions & Considerations
The graphs illustrate a gradual and slow positive price evolution over the first seventeen months following the launch. This period is marked by low prices, with weak month-on-month demand growth and consequently low transaction volumes, as projected in the business plan. Over this timeframe, the price increase is modest:
- +92% in the conservative scenario,
- +201% in the standard scenario
- +297% in the optimistic scenario (comparing average prices from month 1 to month 17)
A significant positive month-on-month price growth is observed from the seventeenth to the twenty-seventh month. The price increases are:
- +295% in the conservative scenario,
- +417% in the standard scenario,
- +535% in the optimistic scenario (comparing average prices from month 17 to month 27)
Following this period, the pace of growth accelerates sharply. Between the twenty-seventh and thirty-sixth month, there is a pronounced surge in prices, driven by a significant increase in transaction volumes. The observed price increases are:
- +799% in the conservative scenario,
- +1,022% in the standard scenario,
- +1,253% in the optimistic scenario (comparing average prices from month 27 to month 36)
The observed trends support the hypothesis that the token model is designed to facilitate steady growth early on, followed by exponential price increases as adoption scales. The revenue projections appear realistic, particularly if they account for the accelerated growth in later phases. This trend is observable for the three scenarios detailed below:


5. Recommendations
As a recommendation, we suggest extending the analysis beyond 5 years to examine the long-term price evolution, identify the peak point, and determine the potential moment of price stabilization. We should also consider building up benchmarked rational behind the transaction volume evolution and challenge our model by using different price modeling methods e.g. Discounted Cashflow (DCF), Speculative influences, and Macro-economics adjustments.
Appendix A - Data Used
6. PIXPEL Revenue
The PIXPEL revenue model was used as the transaction volume in these calculations.
7. Token Model Supply
For the circulating supply, a preliminary version of the token model has been utilized. Allocations, cliffs, and vesting periods are still subject to potential adjustments. Once the final setup is confirmed, we will re-run our model to ensure accuracy and alignment with the updated parameters.
8. Holding Time
The token is intended to function as a long-term asset, with the average holding period initially set at 3 months, increasing to 3.5 months over time. These estimates are subject to adjustment based on further benchmarking or the incorporation of new data and insights.
- +92% in the conservative scenario,
- +201% in the standard scenario,
- +297% in the optimistic scenario (comparing average prices from month 1 to month 17)
A significant positive month-on-month price growth is observed from the seventeenth to the twenty-seventh month. The price increases are:
- +295% in the conservative scenario,
- +417% in the standard scenario,
- +535% in the optimistic scenario (comparing average prices from month 17 to month 27)
Following this period, the pace of growth accelerates sharply. Between the twenty-seventh and thirty-sixth month, there is a pronounced surge in prices, driven by a significant increase in transaction volumes. The observed price increases are:
- +799% in the conservative scenario,
- +1022% in the standard scenario,
- +1253% in the optimistic scenario (comparing average prices from month 27 to month 36)
The observed trends support the hypothesis that the token model is designed to facilitate steady growth early on, followed by exponential price increases as adoption scales. The revenue projections appear realistic, particularly if they account for the accelerated growth in later phases.
This trend is observable for the three scenarios detailed below:
5. Recommendations
As a recommendation, we suggest extending the analysis beyond 5 years to examine the long-term price evolution, identify the peak point, and determine the potential moment of price stabilization.
We should also consider building up benchmarked rational behind the transaction volume evolution and challenge our model by using different price modeling methods e.g. Discounted Cashflow (DCF), Speculative influences, and Macro-economics adjustments.
Appendix A – Data Used
6. PIXPEL Revenue
The PIXPEL revenue model was used as the transaction volume in these calculations.
7. Token Model Supply
For the circulating supply, a preliminary version of the token model has been utilized. Allocations, cliffs, and vesting periods are still subject to potential adjustments. Once the final setup is confirmed, we will re-run our model to ensure accuracy and alignment with the updated parameters.
8. Holding Time
The token is intended to function as a long-term asset, with the average holding period initially set at 3 months, increasing to 3.5 months over time. These estimates are subject to adjustment based on further benchmarking or the incorporation of new data and insights.